Use case
Many servers, one dashboard.
Logging into each server to read logs and check the firewall doesn't scale. The dashboard brings them all together, shows what each agent is doing and lets the team know.
01The problem
Every server is an island.
With two or three servers, you can log into each one. With ten or thirty, the attack that matters slips by between one login and the next.
And without a central place, nobody notices when a server's agent stops reporting.
02What the dashboard brings together
State, policy, fleet and team.
- 01 · State
Every agent, in real time
Heartbeat every 60 s. After 90 s without contact, the server shows as unknown, not as protected.
- 02 · Policy
One SSH rule per group
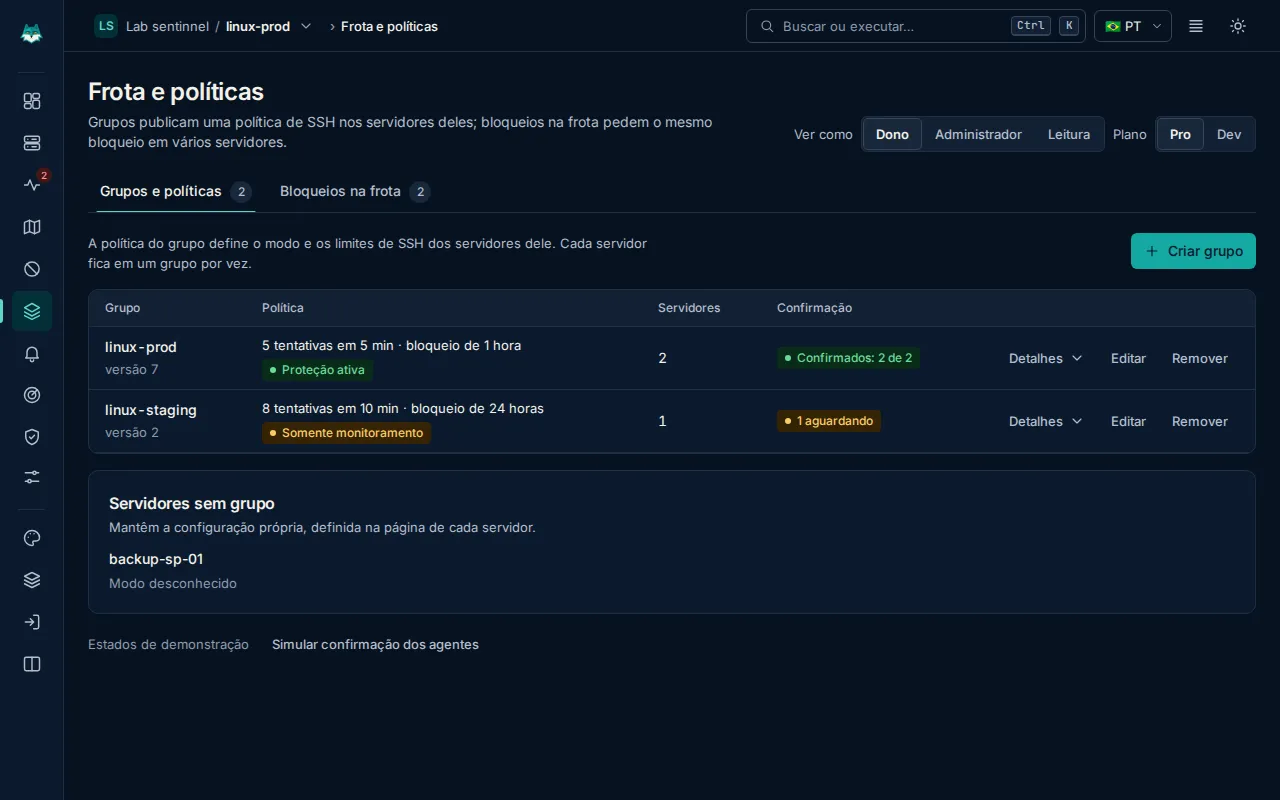
On Pro, the group publishes SSH mode and limits to its servers, and the dashboard shows how many confirmed.
- 03 · Fleet
One block, many servers
On Pro, a fleet block requests the same block on several servers at once.
- 04 · Team
Roles, 2FA and audit
Owner, admin and read-only roles, TOTP two-factor login, a 30-day audit log and per-organization API tokens.
03In the dashboard
Fleet and policies.
04In practice
What comes with it.
- Alerts in the dashboard and by email; on Pro, also via Slack, Telegram and webhook.
- Up to 50 team members on both plans.
- Dev at R$9.90 and Pro at R$24.90 per server per month. Groups, policies and fleet blocks are on Pro.
Founders program
Use atalince from the start.
Pro features for up to 3 servers, free of charge, for 12 months. Every application is reviewed by the team.