01Detection
Every log line becomes an event with a name, a source and a count.
The agent reads the logs your server already produces. No extra network sensor, no open port: what matters becomes an event in the dashboard within seconds.
events
01Sources
Eight sensors, fifteen event types.
The network and integrity detectors only record. Blocking comes from the service sensors, when protection mode is on.
Hover or Tab through the rows.
| Sensor | Events | Response |
|---|---|---|
| SSHjournald · auth.log · secure | SSH brute force · SSH invalid user | Blocks |
| Webnginx and Apache access logs | URL SQL injection · URL cross-site scripting · Web path traversal · Suspicious URL command · Sensitive file probe | Blocks |
| Mailmail.log · maillog · dovecot | Mail brute force | Blocks |
| FTPvsftpd · proftpd | FTP brute force | Blocks |
| DatabasesMySQL/MariaDB · PostgreSQL · MongoDB | Database brute force · Exposed database | Blocks |
| Networkkernel counters | Port scan · Connection flood (incl. SYN flood) | Records only |
| Integrityaccounts, sudo, SSH, PAM, cron, authorized_keys, web roots | Integrity change | Records only |
| Malwareweekly scan · YARA + hashes | Malware detected | Pro · manual quarantine |
Sample line
sshd[2211]: Failed password for root from 203.0.113.42 port 52144 ssh2
Resulting event
SSH brute force · 203.0.113.42 · 48 attempts · port 22
- SSH brute force
- SSH invalid user
Sample line
198.51.100.17 "GET /products?id=1%27%20UNION%20SELECT%20NULL-- HTTP/1.1" 404
Resulting event
URL SQL injection · 198.51.100.17 · 16 attempts
- URL SQL injection
- URL cross-site scripting
- Web path traversal
- Suspicious URL command
- Sensitive file probe
Sample line
dovecot: imap-login: auth failed, 1 attempts: user=<contact>, rip=192.0.2.191
Resulting event
Mail brute force · 192.0.2.191 · 31 attempts
- Mail brute force
Sample line
vsftpd: [admin] FAIL LOGIN: Client "::ffff:203.0.113.89"
Resulting event
FTP brute force · 203.0.113.89 · 12 attempts
- FTP brute force
Sample line
[Warning] Access denied for user 'root'@'198.51.100.140' (using password: YES)
Resulting event
Database brute force · MySQL · 198.51.100.140
- Database brute force
- Exposed database
Sample line
SYN from 198.51.100.204 → 22, 80, 443, 3306, 5432, 6379, 8080 … in 4 s
Resulting event
Port scan · 198.51.100.204 · logged
- Port scan
- Connection flood (incl. SYN flood)
Sample line
/root/.ssh/authorized_keys · content changed · 14:02:11 UTC
Resulting event
Integrity change · authorized_keys · logged
- Integrity change
Sample line
/var/www/html/uploads/x.php · PHP webshell YARA rule
Resulting event
Malware detected · quarantine available in the dashboard
- Malware detected
02Sensor health
Silence is not the same as safety.
If the agent loses access to auth.log, or journald stops answering, the dashboard doesn't show “no attacks”. It shows that the sensor stopped reading. No events is not the same as no risk.
- Reading
Reading
journald · auth.log · nginx
- Not reading
Not reading
worker-sp-01 · check the log source
- Unknown
Unknown
backup-sp-01 · no sample for 42 min
03Context
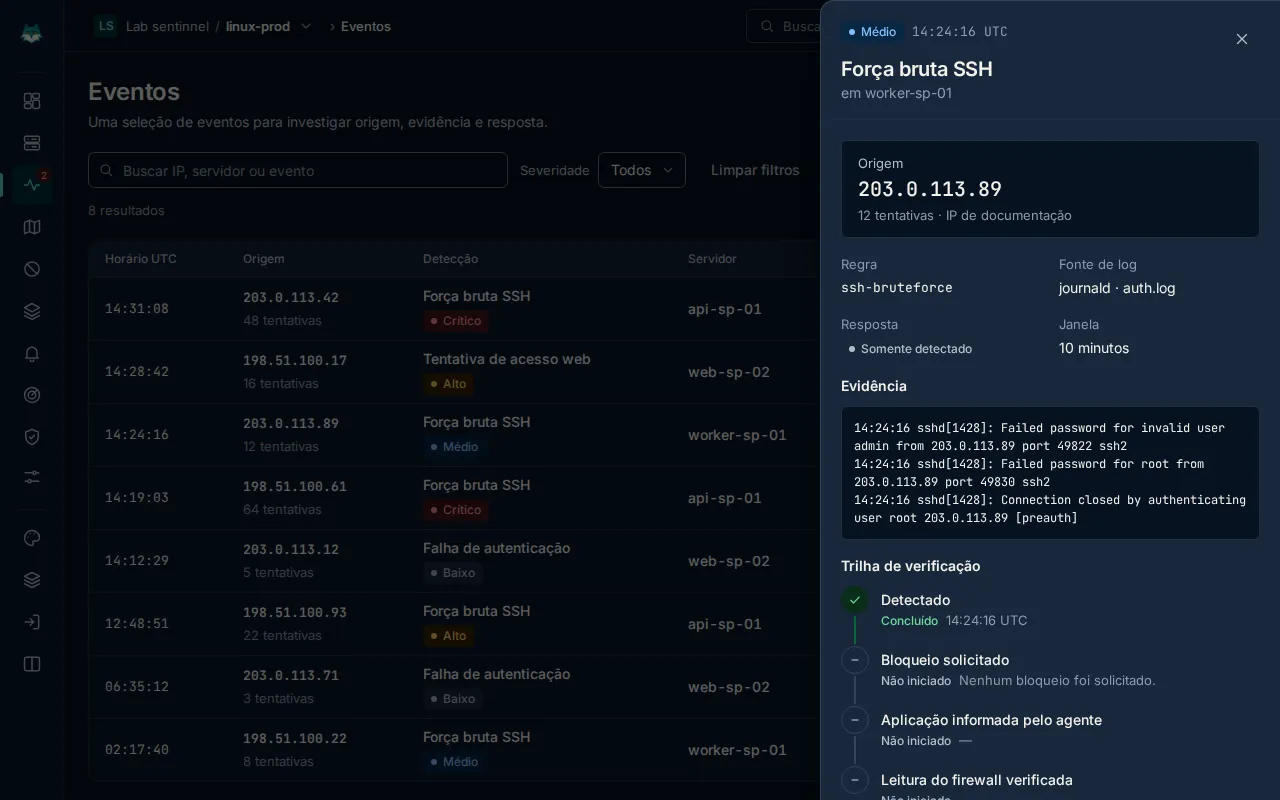
One event, the whole story.
Source, attempts, attacked port, server, IP reputation and the trail of the block it triggered, in the same side panel.
Founders program
Use atalince from the start.
Pro features for up to 3 servers, free of charge, for 12 months. Every application is reviewed by the team.