Product
What happened, where, and what was done about it.
The dashboard answers three questions before anything else: which agents are talking, which sensors are reading, and where protection was confirmed.
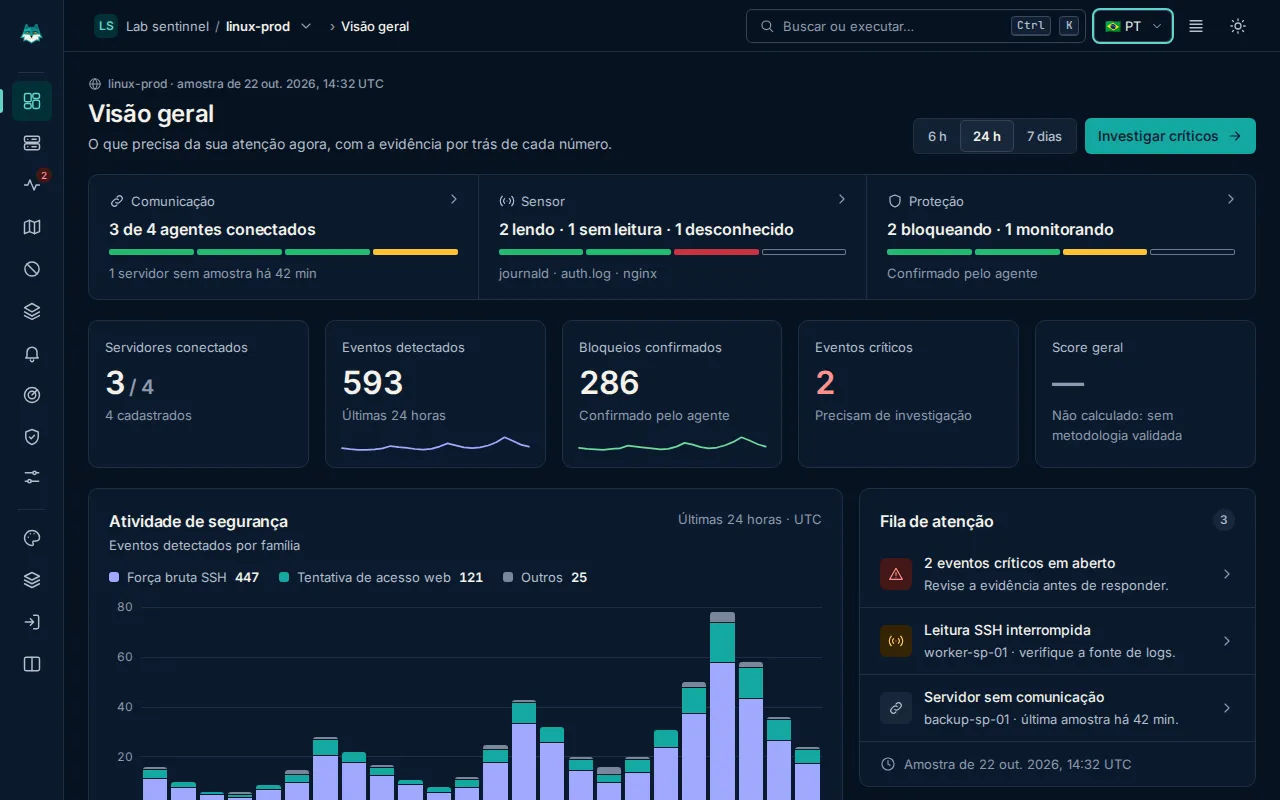
01The five areas
From the raw log to the decision.
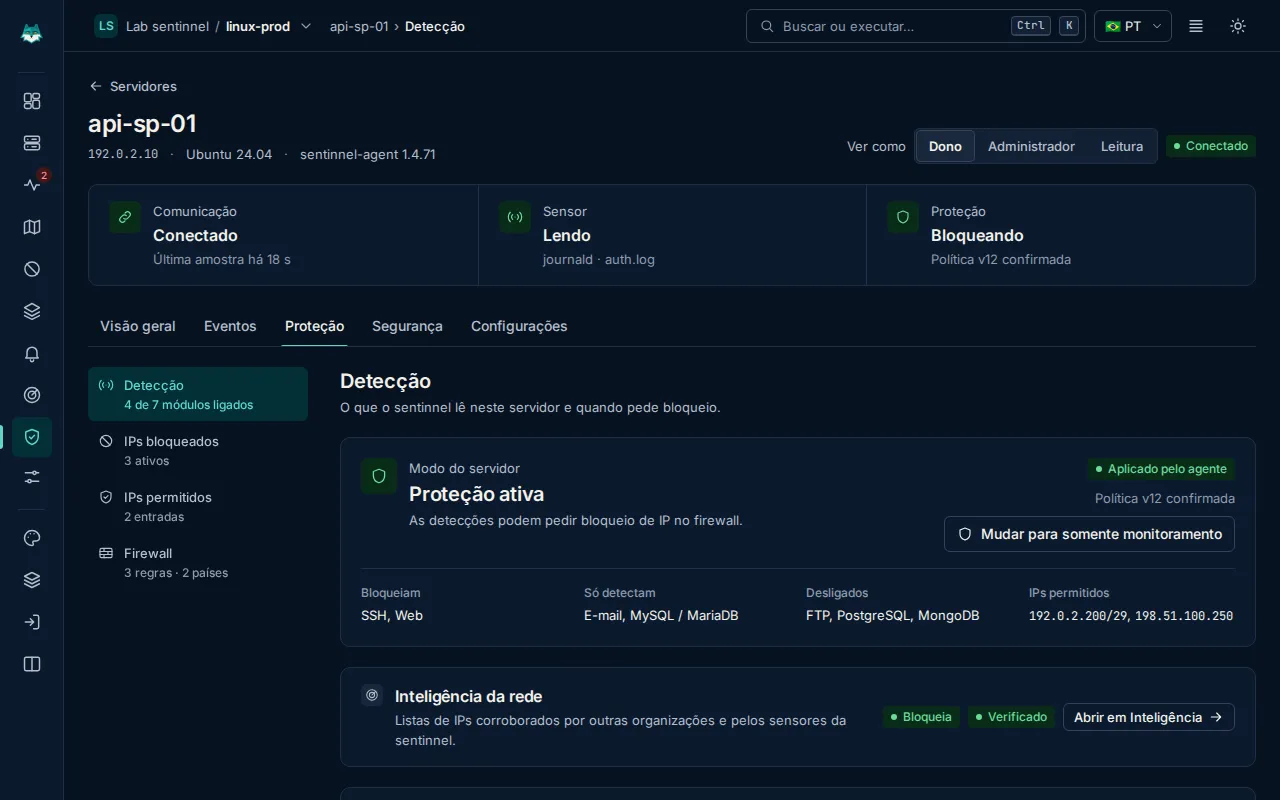
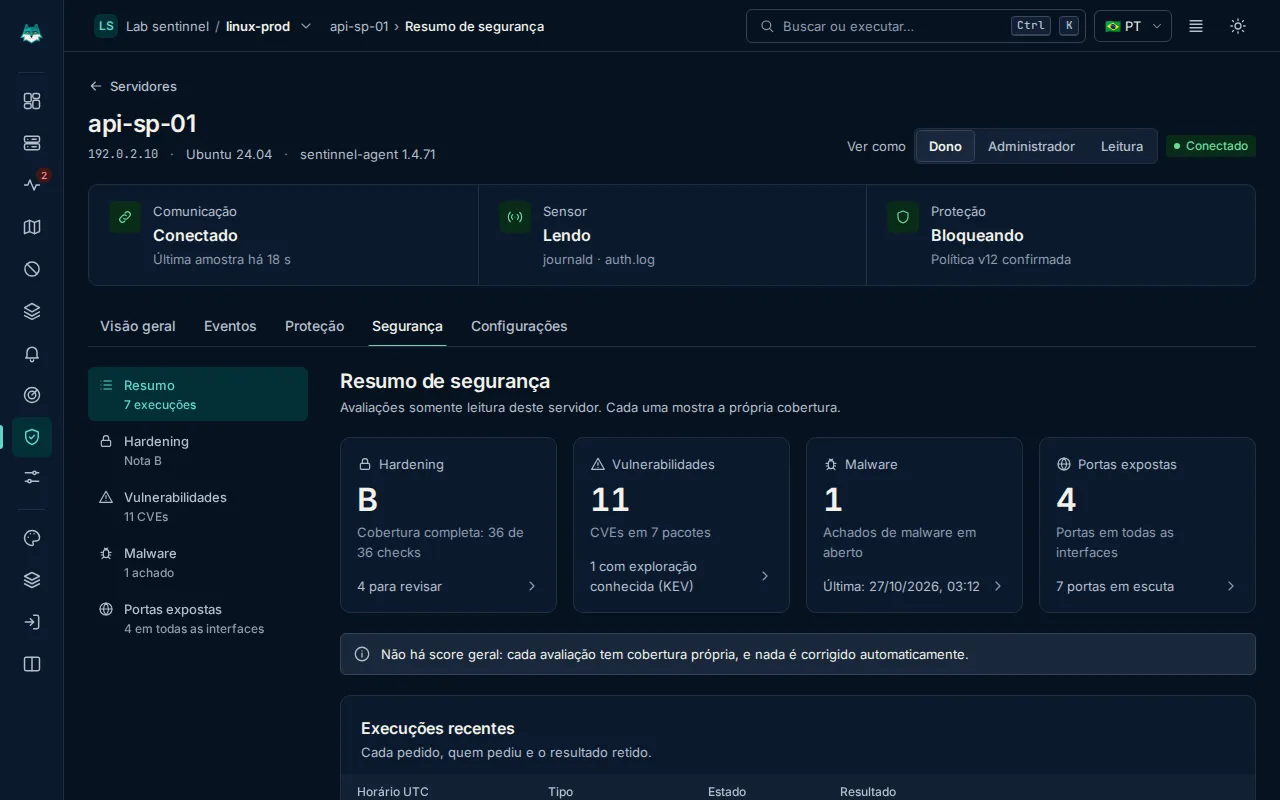
02Operations
Built for people who look after more than one server.
Alerts
In the dashboard, by email, webhook, Slack and Telegram. Daily and weekly email digests for those who want less noise.
- Dashboard
- Webhook
- Slack
- Telegram
- Daily and weekly digest
Team
Up to 50 people per organization, with owner, admin and read-only roles. TOTP two-factor login and recovery codes.
- Owner · admin · read-only
- 2FA (TOTP)
- Active sessions
- API tokens
- 30-day audit log
Fleet and policies
Group servers, apply SSH policies per group and block an IP on up to 100 servers at once.
- Server groups
- SSH policies
- Fleet blocks
- Signed updates
03Tour
The dashboard screens.
Dashboard screens with demo data.
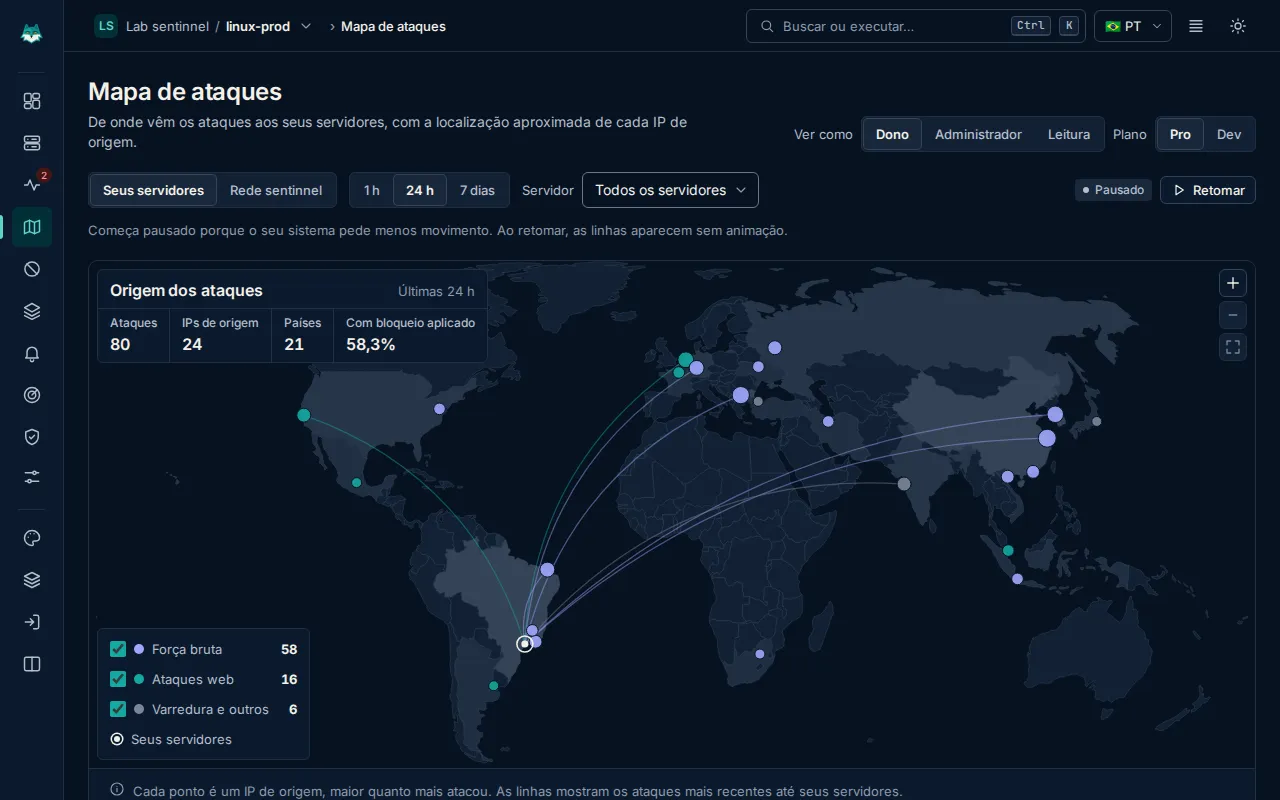
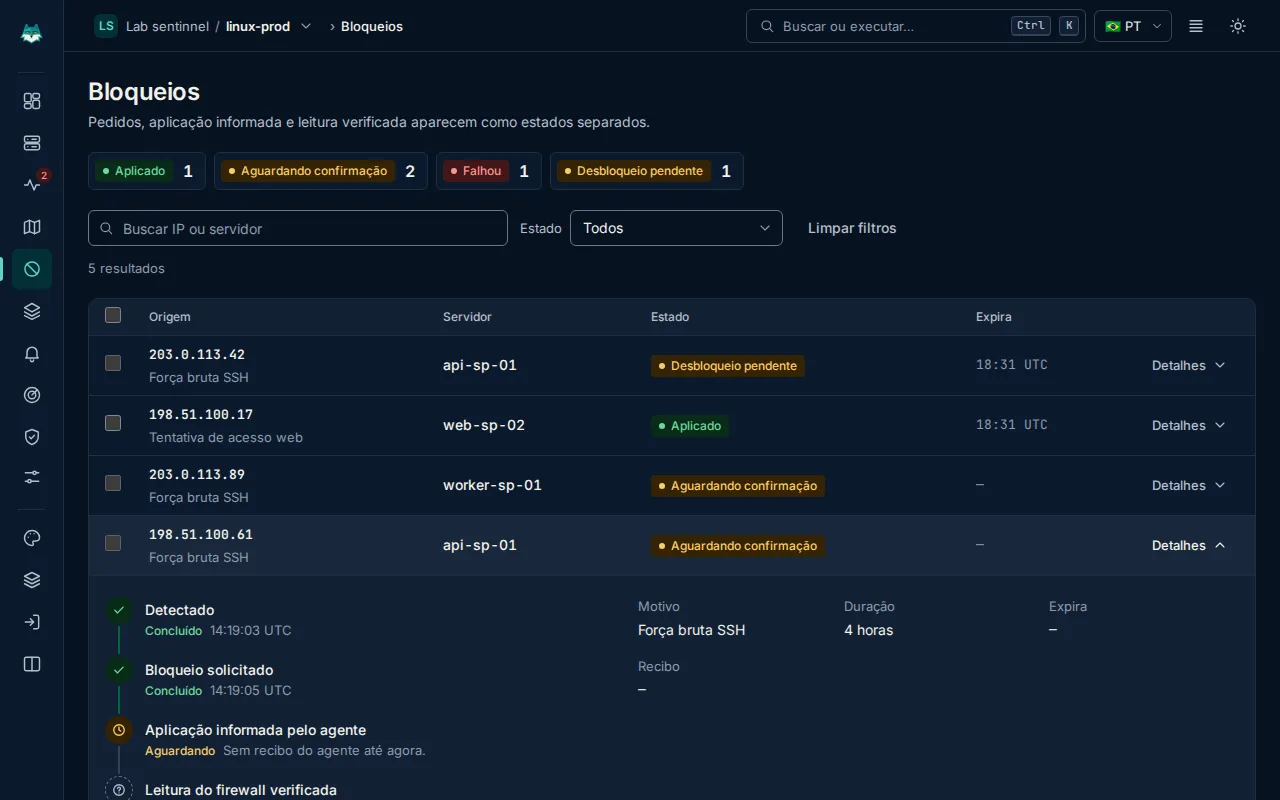
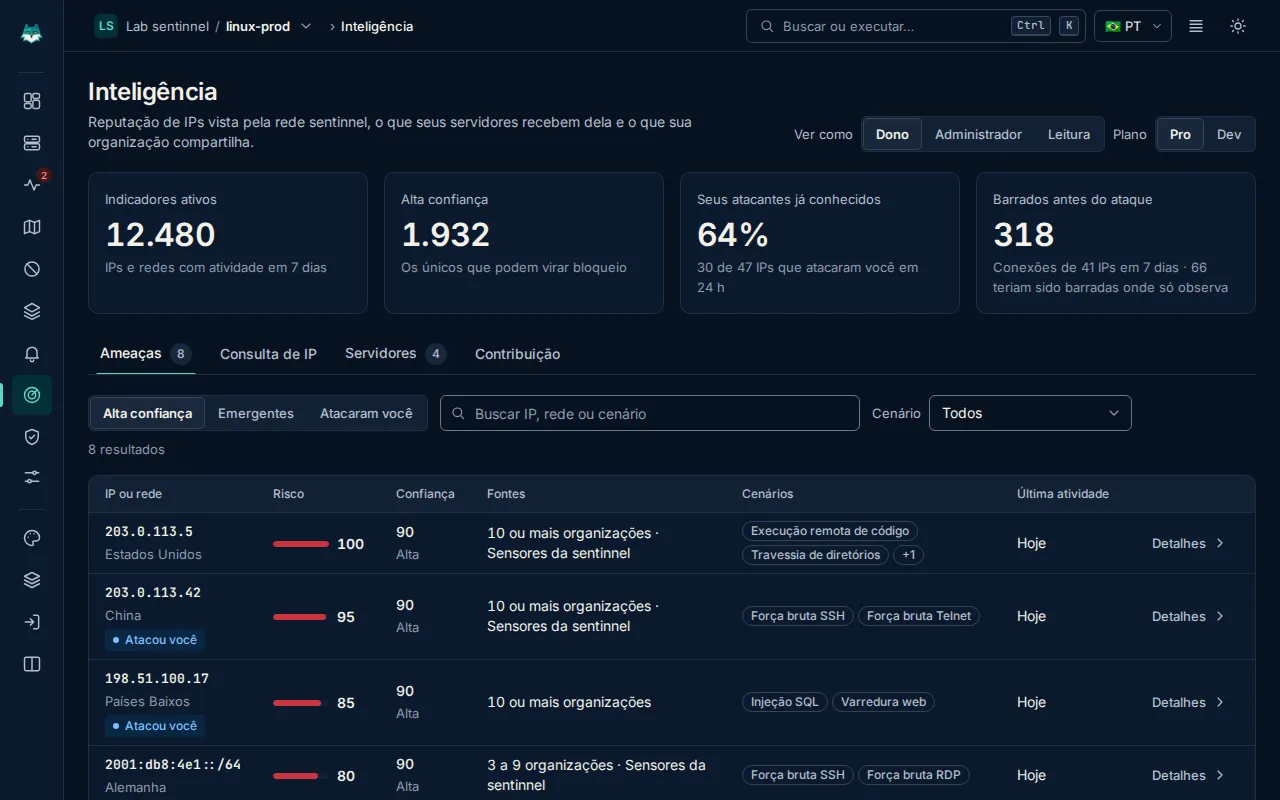
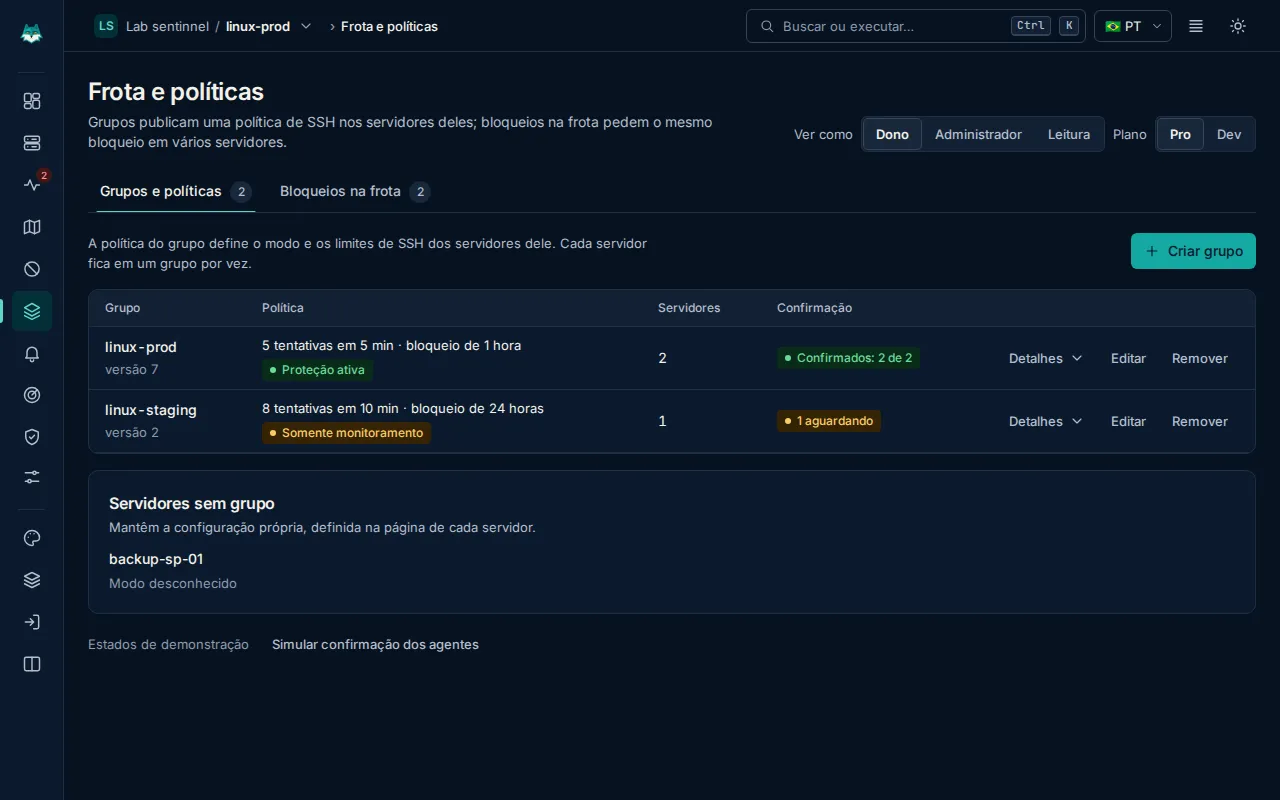
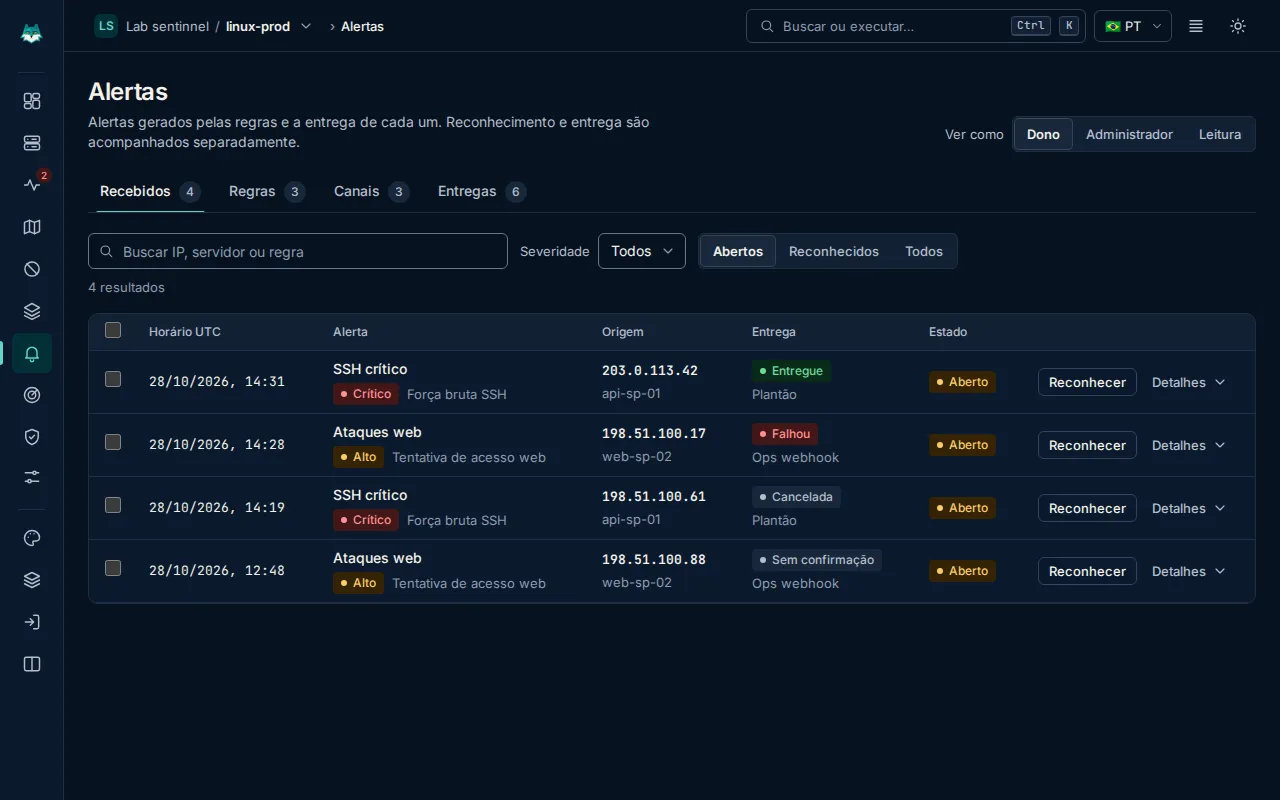
Overview: communication, sensor and protection for each server, the attention queue and recent events.
04Limits
What atalince doesn't do.
We'd rather tell you now than let you find out later.
It is not a WAF in front of your application.
Web detection reads access logs. It identifies SQLi, XSS, path traversal, suspicious commands and sensitive file probes, and blocks the source IP, but it doesn't inspect requests inline.
It doesn't make up an overall security score.
Until there is a validated methodology, the dashboard shows “Not calculated”. The A–F hardening grade only appears with full check coverage.
It doesn't fix things on its own.
Assessments point out the problem and the evidence. The decision and the fix stay with you.
It doesn't run on Windows (yet).
Today the agent is for Linux: Ubuntu, Debian, AlmaLinux and Rocky, on amd64 and arm64.
Founders program
Use atalince from the start.
Pro features for up to 3 servers, free of charge, for 12 months. Every application is reviewed by the team.